- Fontsize
-
S
-
M
-
L
![]()
Financial Highlights
- TAIYO YUDEN CO., LTD. and Subsidiaries
Years Ended March 31 and as of March 31 - Download Data of this table
Cosolidated Financial Statements
Millions of yen
| Fiscal year | 2010 | 2011 | 2012 | 2013 | 2014 |
|---|---|---|---|---|---|
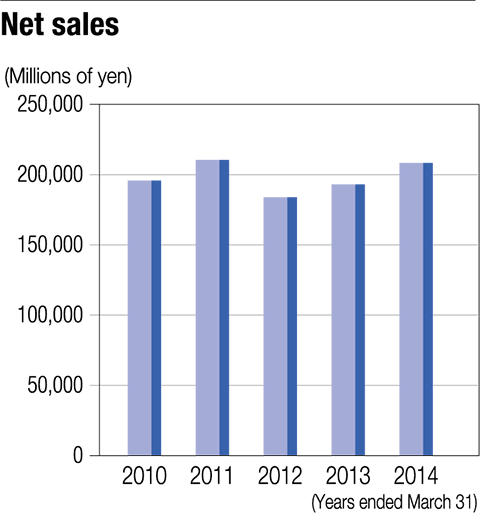
| Net sales | ¥ 195,690 | ¥ 210,401 | ¥ 183,795 | ¥ 192,903 | ¥ 208,222 |
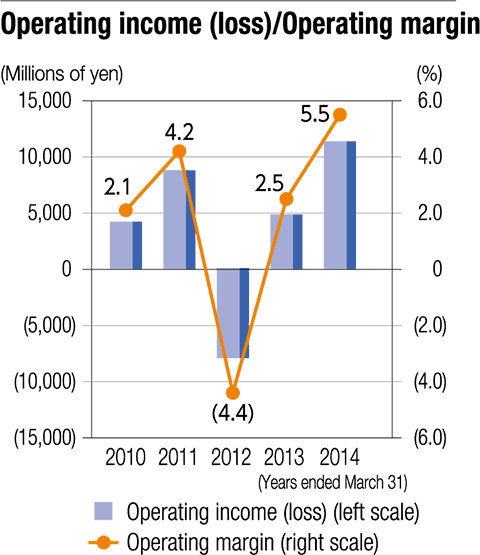
| Operating income (loss) | 4,203 | 8,792 | (8,010) | 4,850 | 11,358 |
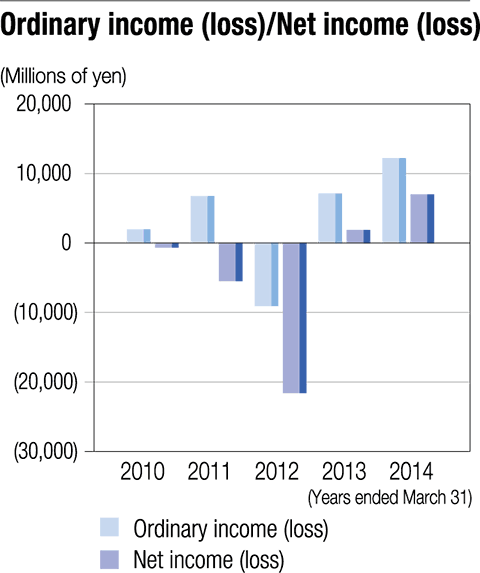
| Ordinary income (loss) | 1,966 | 6,740 | (9,070) | 7,118 | 12,192 |
| Net income (loss) | (680) | (5,506) | (21,599) | 1,867 | 6,989 |
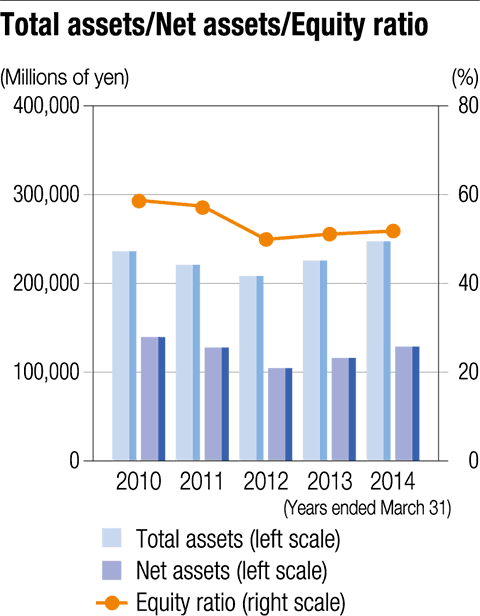
| Total assets | 236,361 | 221,272 | 208,461 | 225,991 | 247,596 |
| Net assets | 139,263 | 127,626 | 104,400 | 115,814 | 128,556 |
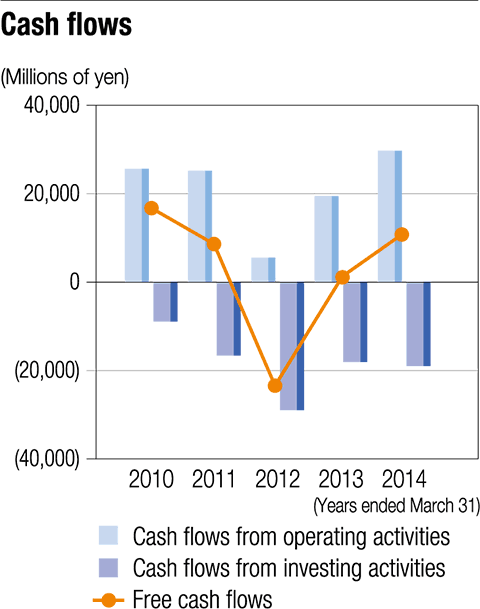
| Cash flows from operating activities | 25,662 | 25,219 | 5,534 | 19,496 | 29,724 |
| Cash flows from investing activities | (8,918) | (16,594) | (28,945) | (18,157) | (18,947) |
| Free cash flows | 16,744 | 8,625 | (23,411) | 1,339 | 10,777 |
| Cash flows from financing activities | (8,775) | (8,948) | 11,388 | 2,334 | 8,404 |
| Cash and cash equivalents at end of year | 40,451 | 38,811 | 26,671 | 33,280 | 54,611 |
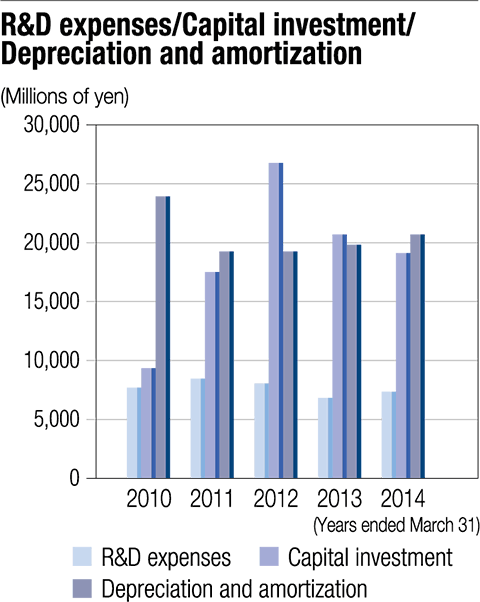
| R&D expenses | 7,698 | 8,475 | 8,068 | 6,840 | 7,353 |
| Capital investment | 9,352 | 17,519 | 26,764 | 20,702 | 19,126 |
| Depreciation and amortization | 23,922 | 19,309 | 19,250 | 19,832 | 20,750 |
| Per share data (yen) | |||||
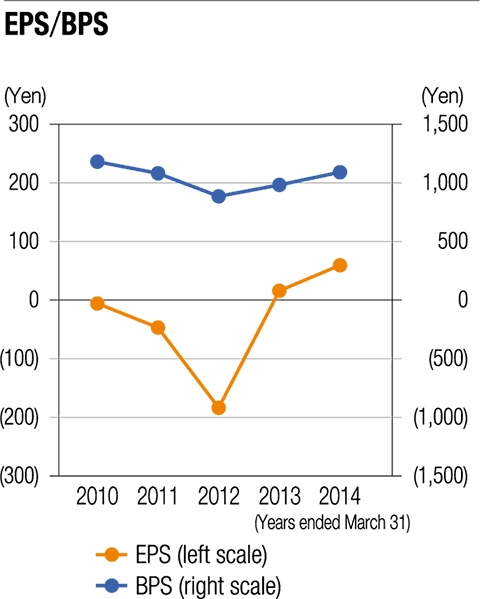
| Net assets per share | ¥ 1,179.82 | ¥ 1,080.61 | ¥ 884.70 | ¥ 981.92 | ¥ 1,090.26 |
| Basic net income (loss) per share | (5.78) | (46.82) | (183.70) | 15.88 | 59.38 |
| Diluted net income per share | - | - | - | 15.85 | 58.09 |
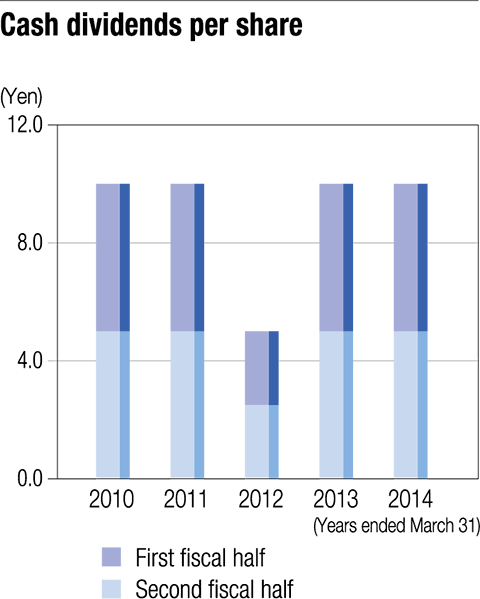
| Cash dividends per share | 10.00 | 10.00 | 5.00 | 10.00 | 10.00 |
| Financial ratios (%) | |||||
| Equity ratio | 58.7 | 57.4 | 49.9 | 51.1 | 51.8 |
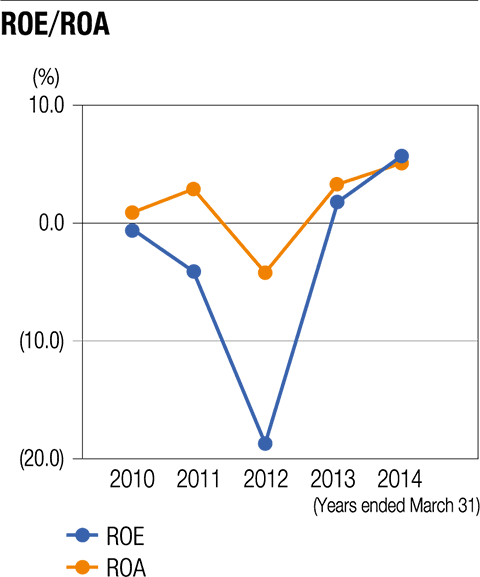
| Return on Equity [ROE] | (0.5) | (4.1) | (18.7) | 1.7 | 5.7 |
| Return on Assets [ROA] | 0.9 | 2.9 | (4.2) | 3.3 | 5.1 |
| Other information | |||||
| Number of employees [consolidated] | 17,836 | 17,267 | 16,194 | 15,915 | 16,435 |
| Number of employees [non-consolidated] | 2,957 | 2,988 | 2,977 | 2,632 | 2,572 |
Note:ROE = Net income/Shareholders' equity (yearly average) x 100
ROA = Ordinary income/Total assets (yearly average) x 100
ROA = Ordinary income/Total assets (yearly average) x 100
This website contains forward-looking statements. These forward-looking statements are not guarantees of future performance, and they involve inherent risks and uncertainties.
A variety of factors including changes in the business environment could cause actual results to differ materially from those in the forward-looking statements.