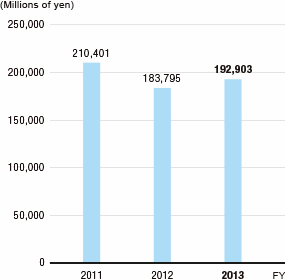
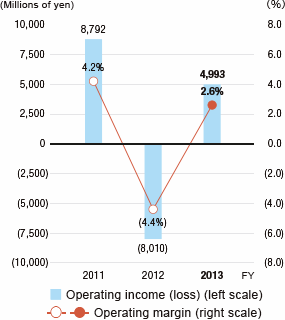
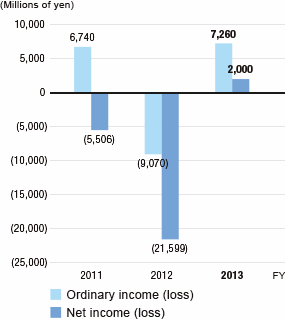
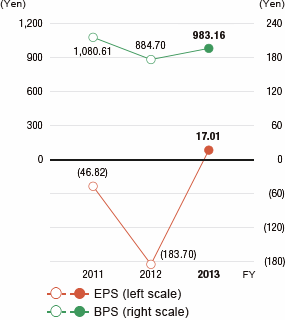
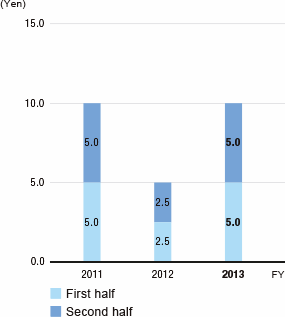
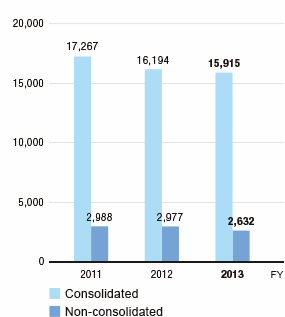
TAIYO YUDEN's Business Performance
-
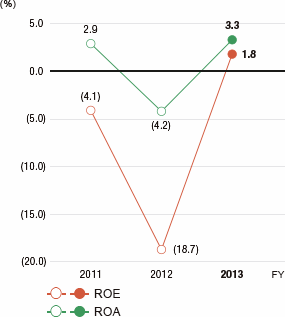
ROE/ROA
-
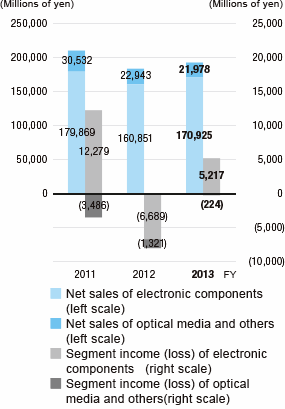
Operating results by business segment
-
Sales by product segment
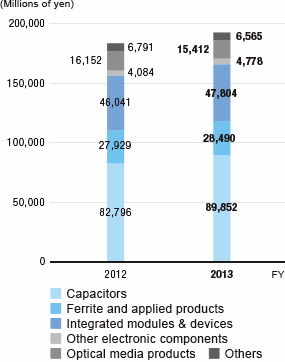
Because this product segment was changed in 2013, the data presented is for the fiscal year ended March 2012.
-
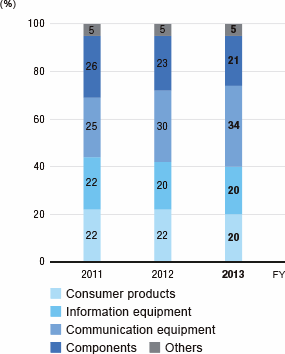
Sales of electronic components by market sector
-
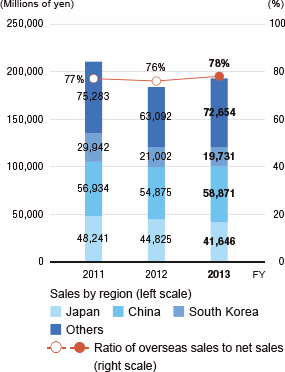
Sales by region/Ratio of overseas sales to net sales
-
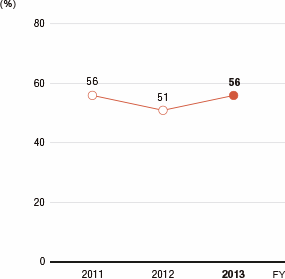
Ratio of overseas production
-
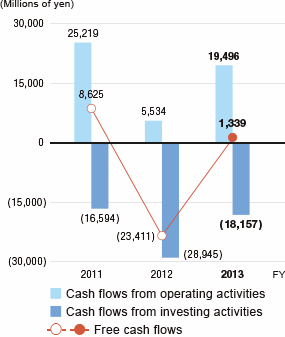
Cash flows
-
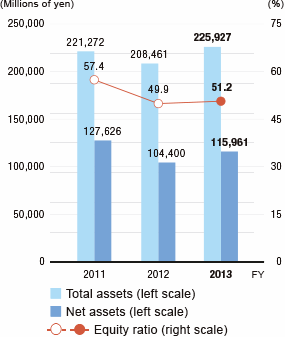
Total assets/Net assets/Equity ratio
-
R&D expenses/Capital investment/Depreciation and amortization
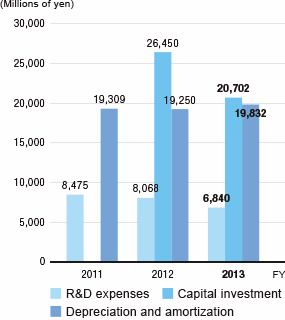
The capital investment for the fiscal year ended March 2011 is not presented because the basis for calculation is different.
-
Energy consumption
(Crude oil equivalent)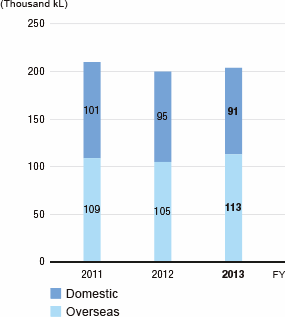
-
Amount of waste generation
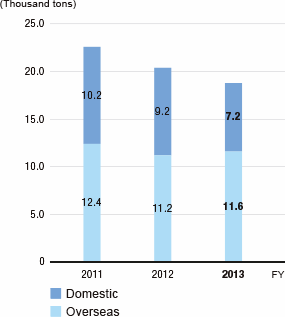
-
Water use
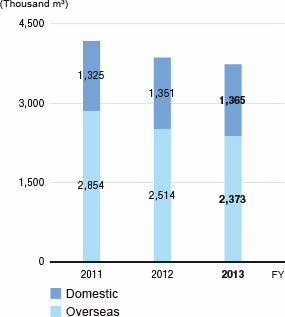
This website contains forward-looking statements. These forward-looking statements are not guarantees of future performance, and they involve inherent risks and uncertainties.
A variety of factors including changes in the business environment could cause actual results to differ materially from those in the forward-looking statements.


