We report efforts and achievements for the environmental load in FY2024 indicated in the page of "Environmental Aspect in Corporate Activities."
The following report covers TAIYO YUDEN CO., LTD.: six sites, and its domestic and overseas consolidated subsidiaries.
- Compliance, Monitoring
- GHG, Energy
- Efforts to Address Climate Change
- Waste, Water
- Environmental action case
- Biodiversity action case
Compliance, Monitoring
We report the result of compliance and monitoring at each site in FY2024.
GHG, Energy
There are three categories for greenhouse gases (GHG) emitted during the course of business activities: direct emissions from energy use (Scope1), indirect emissions from energy use (Scope2) and indirect emissions from sources other than energy use (Scope3). We concentrate on managing and reducing energy consumption.
Results of Efforts to Reduce Greenhouse Gases and Energy Consumption
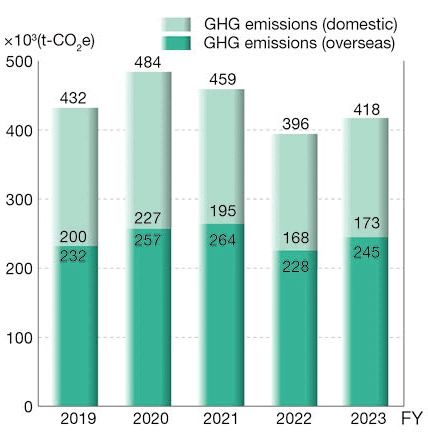
In FY2024, the GHG emissions by the entire group decreased by 36,000 t-CO2e compared to FY2023. Specifically, the emissions by the sites in Japan decreased from 173,000 t-CO2e in FY2023 to 137,000 t-CO2e, and those by the overseas sites remained the same as in FY 2023 at 246,000 t-CO2e (see G1).
The amount of energy used by the entire group was 273,000 kL (crude oil equivalent).
We will continue to review production processes, with a focus on core products, to further improve production efficiency and reduce energy use.
Furthermore, we have been promoting the incorporation of renewable energy in our efforts to combat global warming. The renewable energy used in FY2024 was 270,662 MWh.
-
※As our targets were approved as the SBT, we recalculated the emissions in and after FY2020.
G1: GHG Emissions
(calculated from total energy consumption)
| GHG Emissions (×103t-CO2e) | |
|---|---|
| Scope1 | 58 |
| Scope2 | 325 |
![Total GHG emissions in FY2024:1,420[x10³t-CO₂e] Scope1:58、Scope2:325、Scope3:1,037](/cn/sustainability/environment/performance/images/img_index_4.webp)
Efforts on Indirect Emissions Other than from Energy Use (Scope 3)
In recent years, there has been an increasing demand from our stakeholders to disclose information on Scope3 emissions, in addition to information on Scope1 and Scope2 emissions. In order to respond to such a demand, we are striving to keep track of our Scope3 emissions. To reduce Scope3 emissions, we started engagement with our suppliers.
| Category | Emissions (×103t-CO2e) |
Remarks | |
|---|---|---|---|
| category1 | Purchased Goods and Services | 683 | |
| category2 | Capital goods | 158 | |
| category3 | Fuel- and energyrelated activities (not included in scope1 or scope2) |
102 | |
| category4 | Upstream transportation and distribution | 49 | |
| category5 | Waste generated in operations | 13 | |
| category6 | Business travel | 4 | |
| category7 | Employee commuting | 19 | |
| category8 | Upstream leased assets | 0 | Included in Scope2 |
| category9 | Transportation and delivery (downstream) |
2 | |
| category10 | Processing of sold products | 7 | |
| category11 | Use of sold products | Not applicable | |
| category12 | End-of-life treatment of sold products | 0.1 | |
| category13 | Leased assets (downstream) | Not applicable | |
| category14 | Franchise | Not applicable | |
| category15 | Investments | Not applicable | |
| Total | 1,037 | ||
Efforts to Address Climate Change
In response to the recommendations of the Task Force on Climate-related Financial Disclosure (TCFD), we are proceeding with a scenario analysis of the risks and opportunities that climate change issues pose to society and business, and consider business strategies based on the results.
Efforts to Address TCFD
As the impact of climate change on society, such as frequent storms and floods, is increasing, the role of companies in achieving a decarbonized society is becoming more important.
As we aim to improve our corporate value with a focus on both economic value and social value based on our Medium-term Management Plan 2025. we consider that strengthening the measures to respond to climate change is one of the most important business challenges.
While we promote manufacturing based on the decarbonization concept to achieve carbon neutrality in order to tackle the global issue of climate change, we have set the medium-term target of reducing GHG emissions by 42% compared to FY2020 by FY2030 based on the 1.5℃ SBT, and it was approved by the SBTi as the Near-Term Target in FY2024. To achieve the target, we thoroughly promote energy saving, energy creation, and the utilization of renewable energy.
We aim to contribute to the achievement of the international goals set forth in the SDGs and the Paris Agreement through collaboration with a wide range of stakeholders. We also recognize the importance of climate-related financial information disclosure, endorse the TCFD, and are enhancing information disclosure in accordance with the TCFD recommendations.
Governance
We recognize climate change as one of the important management issues and aim to promote activities for sustainability issues through business activities throughout the company, and since FY2021, we have held the Sustainability Committee (four times a year) chaired by the President and Chief Executive Officer.
In addition, there are directors who have expertise and experience in ESG and sustainability on the Board of Directors.
The Environmental Promotion Committee, a sub-committee of the Sustainability Committee sets quantitative targets for climate change and monitors the status of achievement.
If the targets are not achieved or may not be achieved, the Environmental Promotion Committee needs to investigate the cause and take corrective measures for improvement. The deliberations and decisions by the Environmental Promotion Committee are reported to the Sustainability Committee, which is its superior committee.
Strategy
1 Identification of risks and opportunities
In order to identify climate-related risks and opportunities that affect our business, we used climate scenarios such as the IEA and the IPCC to identify them, qualitatively evaluated their characteristics, and conducted scenario analysis.
| Division | Assumed event | Climate-related risks and opportunities | Degree of financial impact (Profit basis) |
|---|---|---|---|
| Transition risks | Introducing and raising carbon prices | Increasing of operation costs due to introducing of carbon prices | Major |
| Strengthening environment- related regulations |
Increasing of costs for measures due to strengthening of GHG emission reduction targets and energy efficiency improvement targets | Medium | |
| Increasing of costs due to compliance with domestic and overseas environmental regulations | Medium | ||
| Physical risks | (Acute) Intensifying extreme wind and flood damages | Intensified wind and flood damages to sites | Minor - Medium |
| (Chronic) Long-term change in weather patterns | Suspension of production due to water shortages caused by drought and a decline in productivity due to heat waves | Minor - Medium | |
| Opportunities | Acceleration of xEV shift | Increasing in sales of electronic components for the electric vehicle market due to the global shift to xEVs | Major |
| Increased demand for high-efficiency products | Increased sales of electronic components for the industrial equipment market due to increased demand for power supplies with energy management functions to reduce GHG emissions | Major | |
| Increased production efficiency | Secure profits by promoting low-carbon production activities including the development of energy-saving measures and the introduction of renewable energy | Major | |
| Promotion of climate change-related measures | Enhance customer trust by advancing climate change-related measures | - |
- Degree of financial impact:
- Minor=JPY 1.5 billion or less; Medium=JPY 1.5 billion to 6 billion; Major=JPY 6 billion or more
2 Setting the scenario analysis theme
We carried out a scenario analysis on the following themes evaluated as “highly important risks and opportunities” based on the degree of impact on our business, the relevance to our business strategies, and the degree of stakeholder interest.
Transition risks
Target business / Analysis theme
| Common to all businesses | Financial impact of introducing carbon prices on operating costs |
|---|
External information referred to in the analysis
| 1.5℃ scenario | 4℃ scenario | |
|---|---|---|
| Key reference scenarios*1 | NZE (Net Zero Emissions by 2050 Scenario) | STEPS (Stated Policies Scenario) |
| View of the world | A world where CO2 emissions by the global energy sector reach net zero by 2050 and the advanced countries achieve zero emissions ahead of other countries. A world where global temperature rise is limited to 1.5℃ with a probability of 50% or greater in accordance with the emissions reduction target specified in the Sixth Assessment Report of the Intergovernmental Panel on Climate Change (IPCC). | A world where the policies and implementation measures that affect the energy market adopted by the countries as of August 2024, and the related policy proposals are partially implemented. A world where the policies that are highly feasible are implemented without assuming the achievement of the targets set by the government of the countries and the energy transition progresses conservatively. |
| As each country shifts to renewable energy, prices of fossil resources tend to decrease. | As each country depends on fossil resources, prices of fossil resources tends to rise. |
-
*1The analysis is based on the scenarios published in the "World Energy Outlook 2024", the annual report by the IEA (International Energy Agency)
Physical risks
Target business / Analysis theme
| Common to all businesses | Impact of intensified extreme weather disasters on sites |
|---|
This data covers the 17 sites in Japan and 7 sites outside Japan.
We assessed physical impacts at the baseline (current), and at the middle and end of this century.
External information referred to in the analysis
| Information provider | Reference |
|---|---|
| Ministry of Land, Infrastructure, Transport and Tourism | The Geospatial Information Authority of Japan “Web-Based Flood Simulation Search System at an Arbitrary Point (Flood Navigation System),” “Hazard Map Portal Site”, Flood hazard map, Guidance on the Physical Risk Assessment Based on the TCFD Recommendations (March 2023) |
| Fathom | Global Flood Map |
| WRI (World Resources Institute) | Aqueduct Water Risk Atlas V4 |
| IPCC (Intergovernmental Panel on Climate Change)*2,3 | AR6 Climate Change 2021: The Physical Science Basis, Working Group 1 Interactive Atlas |
| Others | Yukiko Hirabayashi et al. (2013). Global flood risk under climate change. Nature Climate Change, 3(9), 816-821. Cui, D., Liang, S., Wang, D., and Liu, Z.: A 1 km global dataset of historical (1979–2013) and future (2020–2100) Köppen–Geiger climate classification and bioclimatic variables, Earth Syst. Sci. Data, 13, 5087–5114, https://doi.org/10.5194/essd-13-5087-2021, 2021. |
-
*2We assessed physical impacts based on the climate scenarios SSP1-2.6 and SSP5-8.5 used in the IPCC AR6.
-
*3The SSP1-2.6 and SSP5-8.5 scenarios correspond to the RCP2.6 and RCP8.5 climate scenarios used in AR5.
Opportunities
Target business / Analysis theme
| Electronic component business | Impact of the global spread of electric vehicles on the sales of electronic components for the automotive market |
|---|
Major pieces of external information referred to in the analysis
| Information provider | Reference |
|---|---|
| IEA | IEA World Energy Outlook 2023 IEA Global EV Outlook 2023 IEA Global EV Data Explorer (Last updated 23 Apr. 2024) |
3 Scenario analysis results
Transition risks: Financial impact of introducing carbon prices on operating costs
- Risk
- Impact of carbon prices on operating costs in 2030 and 2050
- Our climate scenario analysis prerequisites
- Assuming that a carbon price of approximately 19,600 yen will be imposed on each ton of GHG emissions in 2030 and approximately 35,100 yen in 2050, we forecast the impacts of carbon prices. Carbon prices are set based on (IEA World Energy Outlook 2024 (Net Zero Emissions by 2050 Scenario, Stated Policies Scenario).
- Analysis result
-
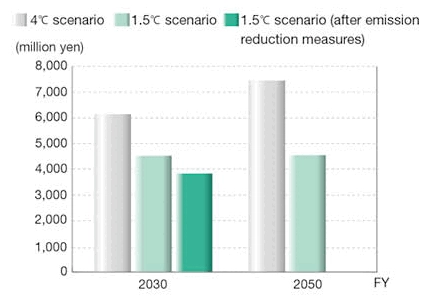
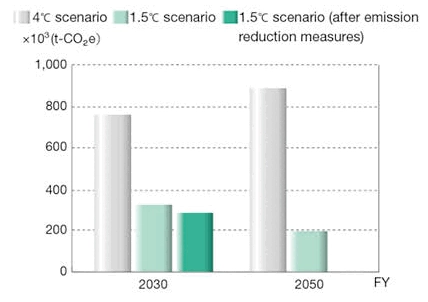
We forecast future GHG emissions trends and the financial impact on operating costs if carbon prices were introduced. Under the 1.5℃ scenario, if GHG emissions reduction measures were implemented, costs would have been reduced by about 3.3 billion yen as of 2030 and by 400 million yen as of 2050 compared with the scenario where no measures are taken (see G1). In addition, although we are promoting the introduction of renewable energy, even if the power is 100% renewable energy, the remaining Scope1 emissions in the 1.5℃ scenario will be 100,000 t-CO2 (see G2), and the impact of the carbon price will be about 3.3 billion yen.
G1: Carbon price effect
G2: GHG emissions trends
- Strategy
- In order to reduce energy consumption, we believe that it is necessary to improve production efficiency by reviewing our production processes, focusing on our core products, along with promoting the introduction of renewable energy. In addition, we plan to consider measures to reduce the remaining Scope1 emissions toward the achievement of carbon neutrality.
Physical risks: Impact of intensified extreme weather disasters on sites (Floods and Storm Surges)
- Risk
- Impact of increased weather disasters associated with climate change on our manufacturing sites at the middle and end of this century
- Our climate scenario analysis prerequisites
- We assessed 24 sites inside and outside Japan based on public hazard information and various information obtained for climate change impact assessment.
- Analysis result
-
We assessed the potential for manufacturing site damage due to intensifying extreme floods and storm surges, and screened sites that require priority investigation of the impact of physical risks.
We independently graded baseline (current) flood and storm surge risks and assessed the changes in the current to mid-century or end-of-century grades based on the RCP2.6 and RCP8.5 climate scenarios.
Regarding floodings, there is one site in Japan that seemed to be at high risk at present, but there was no change in the grade in the future.
On the other hand, there are no overseas sites that are currently considered to be at high risk, and there is no change in the grade in the future. As for storm surges, there are no domestic and overseas sites that are currently considered to be at high risk and there is no change in the grade in the future.Flood risk Number of Sites Rated as Major Hazard (Grade A) 2005 2050 2085 - RCP2.6 RCP8.5 RCP2.6 RCP8.5 Japan (17 sites) 1 site 1 site 1 site 1 site 1 site Outside Japan (7 sites) 0 site 0 site 0 site 0 site 0 site Storm Surges risk Number of Sites Rated as Major Hazard (Grade A) 2010 2050 2090 - RCP2.6 RCP8.5 RCP2.6 RCP8.5 Japan (17 sites) 0 site 0 site 0 site 0 site 0 site Outside Japan (7 sites) 0 site 0 site 0 site 0 site 0 site - Strategy
- In the future, we will investigate in detail the sites that have been assessed as being at high risk based on the results of this analysis and take preventive measures such as installing equipment to minimize flooding on site and ensuring the installation height of the power supply system if deemed necessary. In addition, we will establish a stable product supply system based on our Business Continuity Plan(BCP), which will enable us to resume business activities as soon as possible in the event of a business continuity problem such as a shutdown.
Risk management
Regarding climate-related risks, we assign Executive Operating Officer who is a responsible director of safety and environment, reports and deliberates these issues at the the Internal Control Committee through the Compliance Subcommittee and the Risk Management Subcommittee in accordance with the group management system. We refer to the social situation analysis, interviews with customers and suppliers, and ESG-related engagement process with investors as tools to identify risks and opportunities related to climate change. The impact of these risks has been assessed in relation to their financial impact and management strategy.
Indicators and targets
GHG emissions
The Taiyo Yuden Group has set the target of reducing GHG emissions through its business activities by 42% by FY2030 compared to FY2020, which is consistent with the 1.5℃ scenario, to contribute to the global initiatives to limit the temperature rise to 1.5℃. In order to achieve this target, we are steadily promoting the efforts to reduce GHG emissions through measures to improve production efficiency and to use renewable energy as well as to smoothly move forward with our plan by introducing the energy-saving measures and photovoltaic facilities. We switch power consumption to 100% renewable energy at the two domestic sites in FY2024, and plan to further reduce our GHG emissions by expanding 100% renewable energy sites and taking other measures.
Please refer to "GHG, Energy".
Target
The GHG emission reduction targets the Taiyo Yuden Group set have been accepted as the targets based on scientific evidence and approved by the SBTi, an international initiative, as the SBT.
The approved GHG emissions reduction targets of the Taiyo Yuden Group are shown below.
| Scope1+2 | Reduction of 42% in FY2030 (compared to FY2020) |
|---|---|
| Scope3(Category 1 and 3) | Reduction of 25% in FY2030 (compared to FY2021) |
The Taiyo Yuden Group was selected by CDP*, an international environmental nonprofit organization, as an A List company, earning the highest rating for its outstanding transparency and leadership in performance in the field of climate change for the third consecutive year.
External Assessment of Climate Change Information Disclosure
The Taiyo Yuden Group was selected by CDP*, an international environmental nonprofit organization, as an A List company, earning the highest rating for its outstanding transparency and leadership in performance in the field of climate change for the third consecutive year.
-
※CDP is a non-governmental organization (NGO) managed by a British charitable organization, established in 2000. It operates a global information disclosure system for investors, companies, countries, regions, and cities to manage environmental impacts including reducing their own greenhouse gas emissions, protecting water resources, and protecting forests.
Waste, Water
We strive to reduce environmental effect on biodiversity while coexisting with nature, and we use the 3Rs (reduce, reuse, recycle) to reduce waste and make effective use of water resources.
Results of Reducing Waste
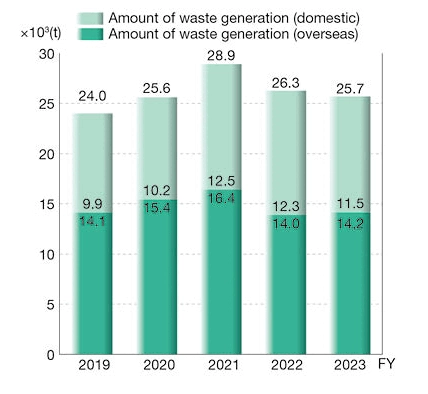
The amount of waste generated in FY2024 by the entire group increased to 28,100 tons from 25,000 tons in FY2023 (see G1).
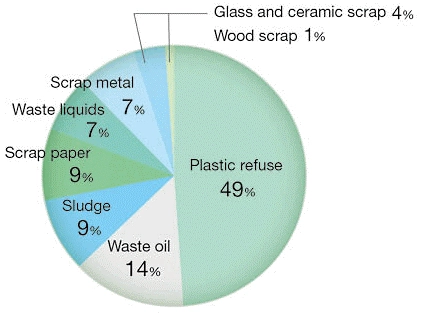
The waste(including valuables)mainly consists of waste plastic, waste oil, and sludge (see G2).
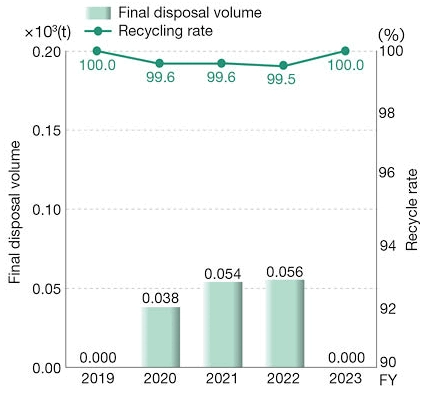
The domestic final disposal volume remained the same as in FY2023 at 0 tons. The waste recycling rate reached 100% (see G3).
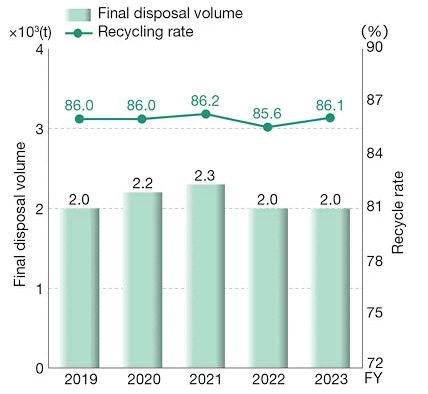
The overseas final disposal volume was increased to 2,200 tons from 2,000 tons in FY2023 (see G4).
We will continue working to reduce waste volumes, boost in-house recycling rates, and recycle waste into resources at our overseas sites.
-
※As the definition of waste was reviewed, we recalculated the amount of waste generated.
G1: Amount of Waste Generation
G2: Breakdown of Waste
G3: Domestic Final Disposal Volumes and Recycling Rates
G4: Overseas Final Disposal Volumes and Recycling Rates
Resource Recycling Efforts
92% of the waste generated through our business activities is recycled and reused as resources in society. However, we are also promoting efforts to reuse waste for the Taiyo Yuden Group’s own business activities.
For solvent A, which is the most frequently used solvent in our business, 46% of the amount used is recycled waste solvent.
In addition, for reels that are used in packaging electronic parts, strict quality checks are performed and 1.4% of all the reels are recycled reels.
Results of Water Resource Efforts
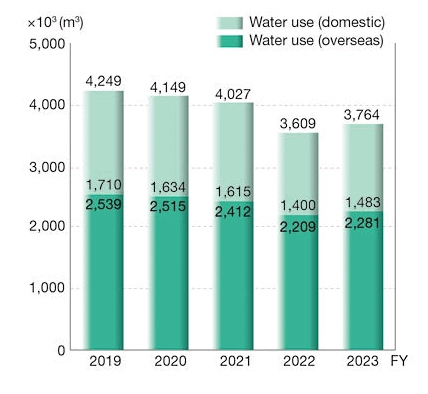
The amount of water used by the entire group increased from 3,764,000 m3 in FY2023 to 4,259,000 m3 in FY2024. Specifically, the amount of water used by the sites in Japan decreased from 1,483,000 m3 in FY2023 to 1,426,000 m3 and those by the overseas sites increased from 2,281,000 m3 in FY2023 to 2,833 ,000 m3 (see G5).
The quantity of water withdrawals was 3,918,000 m3 from municipal water supplies (or other water supply facilities), and 341,000 m3 from freshwater and underground water.
The quantity of water recycled was 648,000 m3.
G5: Water Use
Breakdown of water withdrawals
| Quantity of water withdrawals (×103m3) | |
|---|---|
| Municipal water supply (or other water supply facilities) |
3,918 |
| Freshwater/ underground water |
341 |
Environmental action case
Reducing Greenhouse Gas Emissions
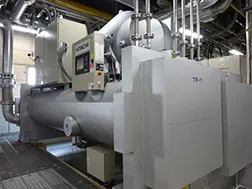
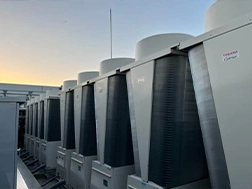
Reduction of energy consumption by refrigeration machines and air conditioners
[TAIYO YUDEN Mobile Technology / ELNA (THAILAND)]
As various pieces of infrastructure equipment are operated to maintain the operation of production equipment and the working environment, we make various efforts to improve their efficiency. We changed refrigeration machines at TAIYO YUDEN Mobile Technology and air conditioners at ELNA (THAILAND) from the fixed speed type to the invertor type, which enabled us to efficiently control their operation in accordance with the status of operation of the plants and reduce electricity consumption.
We reduced GHG emissions by 2,106 tons -CO2e per year.
Reduction of GHG emissions by utilizing waste heat from compressors
[TAIYO YUDEN (GUANGDONG)]
Efforts to use energy in the production process with no waste are being promoted at our plants. TAIYO YUDEN (GUANGDONG) introduced the heat collection system that collected compression heat from compressors as waste heat. By generating warm water using collected waste heat and supplying it to the boiler, fuel consumption by the boiler was reduced.
We reduced GHG emissions by 226 tons -CO2e per year.
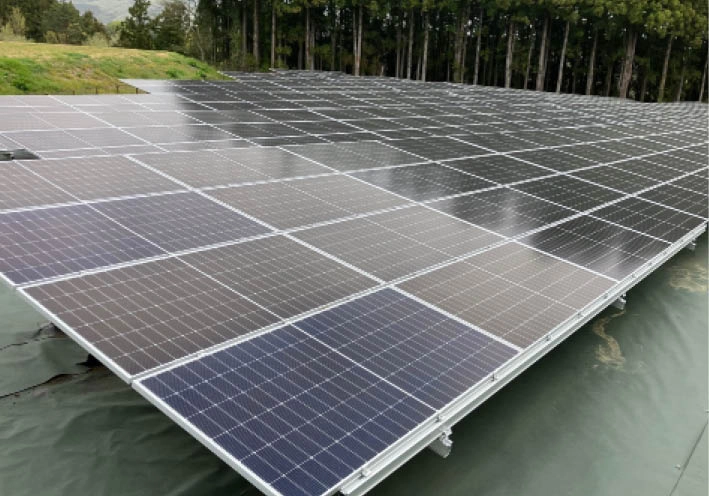
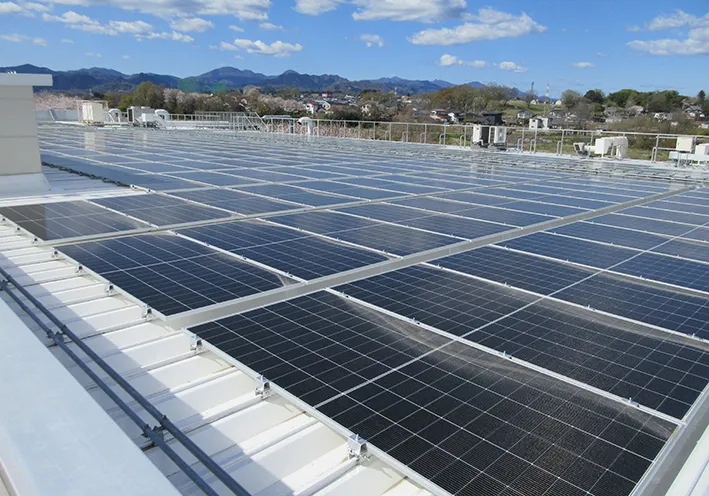
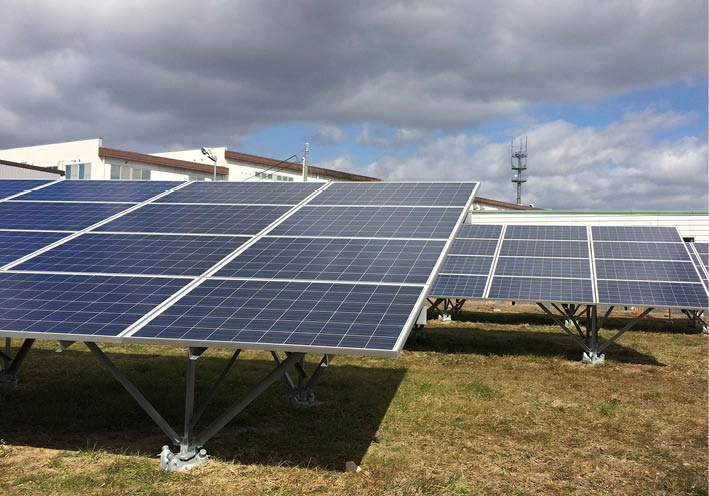
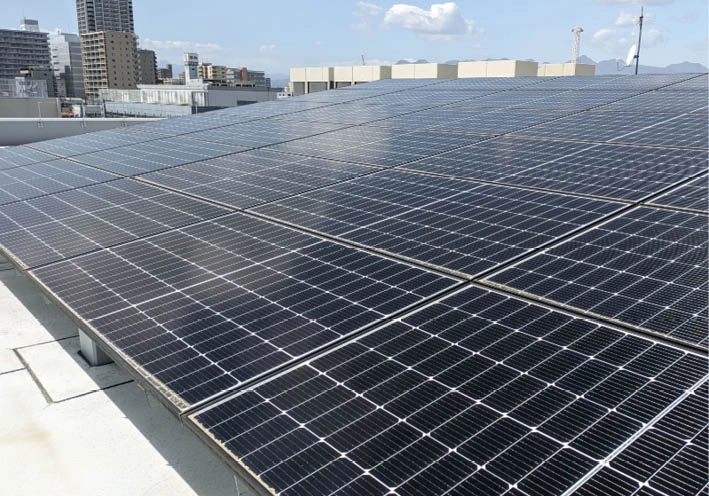
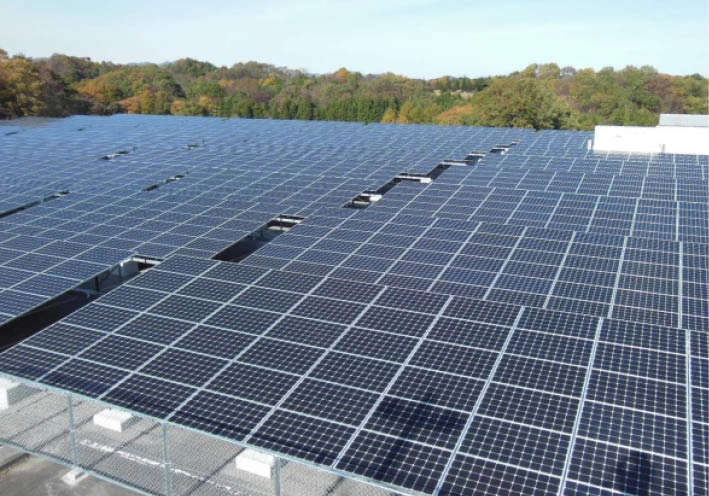
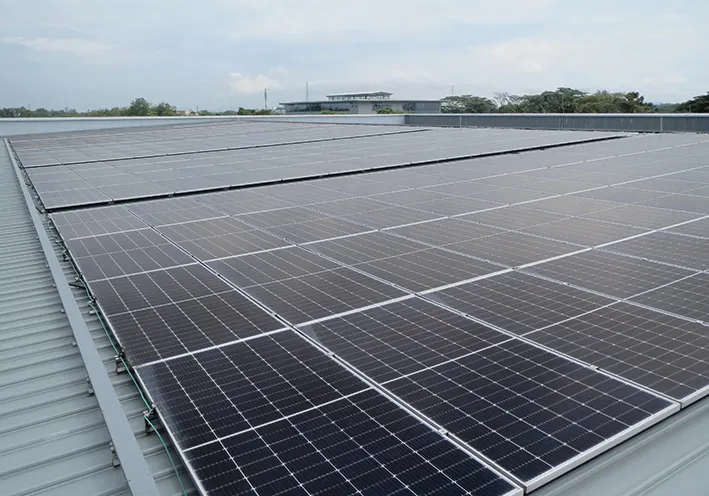
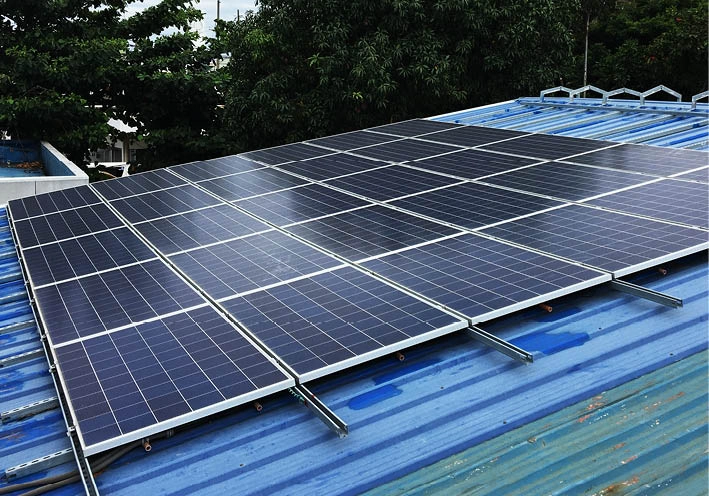
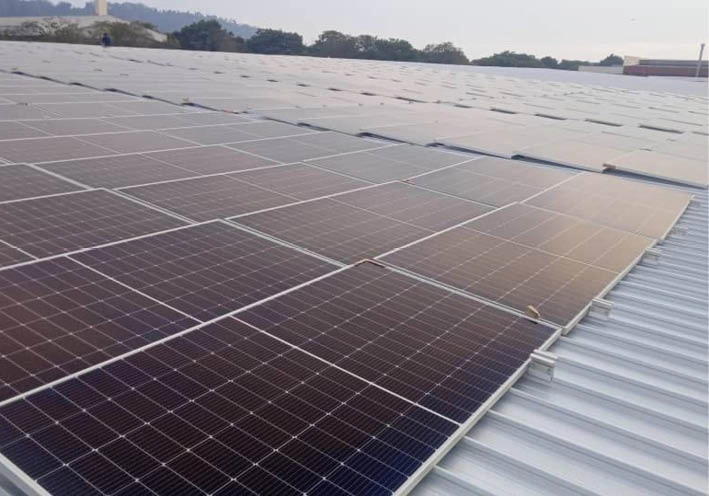
Efforts to energy creation
The Taiyo Yuden Group has been installing solar panels as part of our efforts to combat global warming. After establishing the group’s first power-generating sute, Hongo Photovoltaic Power Plant in FY2013, others have been built as well, and there are currently 13 powergenerating sites in Japan and overseas.
We installed solar panels at 3 sites in FY2024.
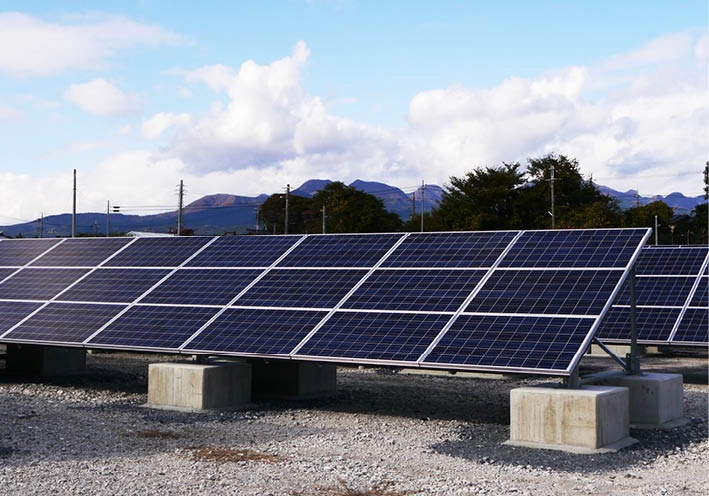
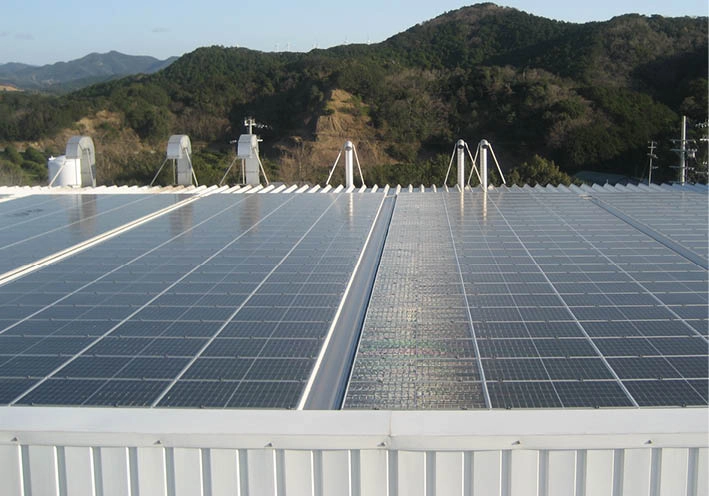
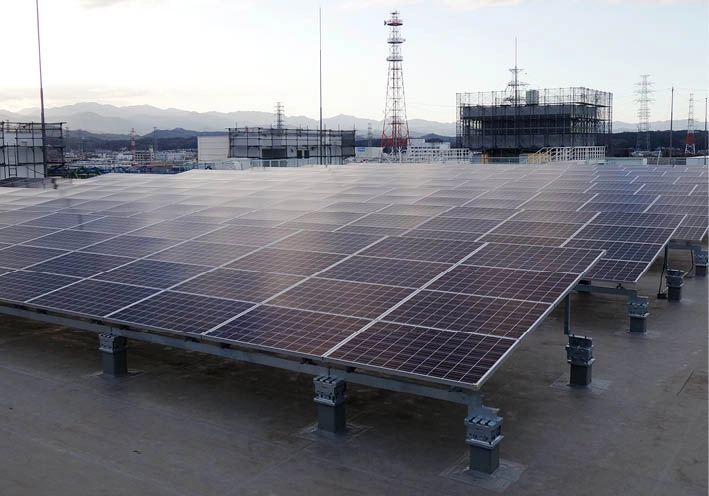
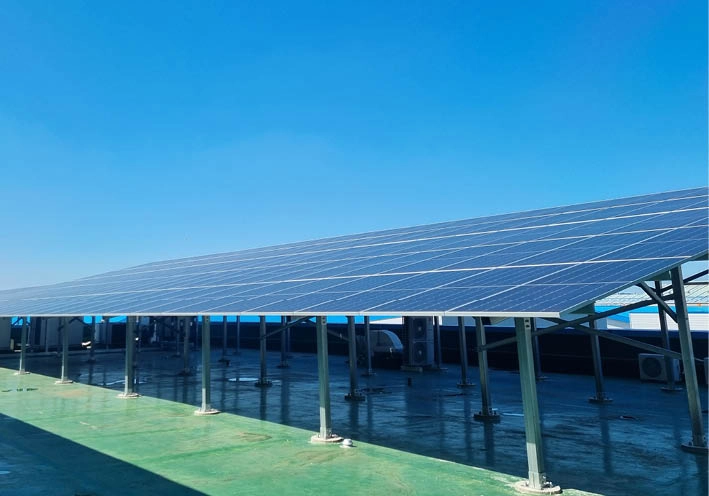
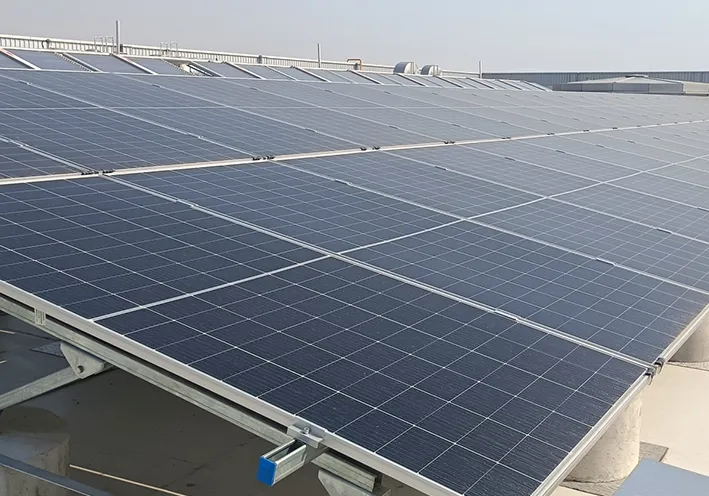
Efforts to utilize renewable energy
The Taiyo Yuden Group has been expanding the use of renewable energy. We transformed electricity supply to R&D Center and Sun Vertex to 100% renewable energy by installing photovoltaic facilities on the premises and switching to energy creation and electricity from renewable energy.
Reduction in Waste Generation
Reduction of wastewater by changing the production method
[Tamamura Plant/TAIYO YUDEN (SARAWAK)]
In some parts of the production process of electronic components, solvents are used to clean the production equipment, and the solvents are properly treated as wastewater after being used for cleaning. By reviewing the production method and decreasing the amount of solvents used for cleaning, the amount of wastewater generated was reduced.
We reduced waste liquid by 140 tons per year.
Reducing Water Use
Water conservation by wastewater recycling
[NIIGATA TAIYO YUDEN]
In the process where electronic components are plated, water is used in a variety of processes. Water use was reduced by collecting and treating water generated from some parts of the production process and reusing it for infrastructure equipment.
The amount of water used was reduced by 64,332 tons per year.
Biodiversity action case
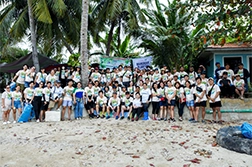
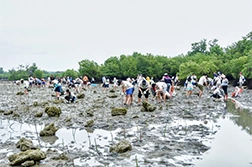
Mangrove Tree Planting
[TAIYO YUDEN (PHILIPPINES)]
In FY2008, Taiyo Yuden (Philippines) began planting mangrove seedlings on Olango Island, near Mactan Island where the company is located. Mangrove trees are planted.
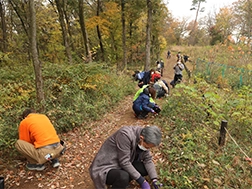
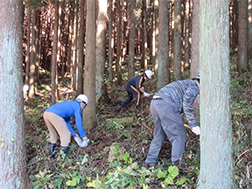
Volunteering for Forest Maintenance
[TAIYO YUDEN]
Since FY2007, Taiyo Yuden has participated in a forest maintenance project run by Gunma Prefecture, involving corporate volunteer work. Every year, volunteers from Taiyo Yuden have helped to maintain the "Taiyo no Mori" forest, joining with prefectural government employees to trim underbrush and thin trees.
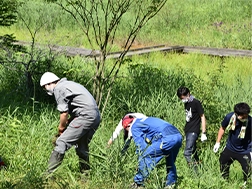
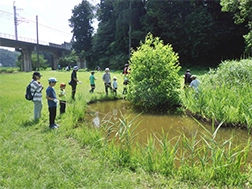
Extermination of alien species (red swamp crawfish)
[NIIGATA TAIYO YUDEN]
The crayfish is included in the list of designated Invasive Alien Species because they have disruptive effects on Japan's indigenous species including aquatic organisms and plants.
Niigata Taiyo Yuden leads a biodiversity conservation activity every year in which employees and their family members exterminate crayfish. They also exterminate alien plants such as daisy fleabanes.
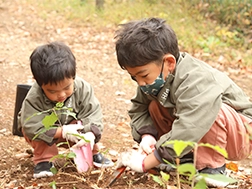
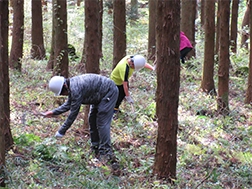
Forest conservation volunteers (treatment for "japanese oak wilt")
[TAIYO YUDEN MOBILE TECHNOLOGY]
Taiyo Yuden Mobile Technology conducts volunteer activities with its employees and their family members to collect oak saplings grown from acorns as a treatment for ”Japanese oak wilt*". The collected oak saplings are grown in the forest park and will be planted in the forests affected by "Japanese oak wilt*".
-
*"Japanese oak wilt": A disease in which various types of oak tree suddenly wither, and the damage is expanding throughout Japan.